The 2020 environmental indicators: A deep dive
1 September 2020
Just last week, the Central Statistics Office released its Environmental Indicators Report for 2020 – and there is a lot to unpack. We spent a couple of days going through it and pulled out some observations on what got better, what got worse, and what stayed the same.
Here we go.
(But actually, just a quick note before we start – while this report has “2020” in the title, the data in it predominantly sheds light on 2018 and 2019 trends. Data takes a while to collect, so we won’t have the breakdown on trends for this rollercoaster of a year until 2021/2022).
Okay. Now here we go.
Things that have gotten worse
We’ll give you the bad news first, then the somewhat better news. We’re going to also put them in bullet points – a format we don’t usually do over here, but there’s a first for everything.
- Total greenhouse gas emissions have gone up. Ireland’s total greenhouse gas emissions were 60.9 million tonnes of CO2 equivalent for 2018, up 200,000 tonnes from the 2017 figure. It’s also almost a ten per cent increase from the 1990 figure, which clocked in at 55.5 million tonnes of CO2 equivalent.
- Agricultural emissions. The sector is the country’s largest emitter, and its contribution rose slightly from 33.3 per cent in 2017 up to 33.9 per cent in 2018, making it now account for over a third of total emissions. This trend continues to mark us as an outlier of sorts within the EU, as member states’ agricultural emissions average out at 10 per cent.
- Transport emissions. They’ve increased ever so marginally, clocking in at 20.1 per cent of 2018 emissions compared to 19.8 per cent in 2017. The sector back in the early 1990s accounted for about 10 per cent of emissions and have since doubled.
- Organic farming isn’t doing too great. We saw the slightest of decreases in respect to these numbers, as we went from 1.5 per cent of total agricultural land being used for organic farming in 2017 to 1.4 per cent in 2018. And while the CSO rightly notes the increase in organic land increased by 257 per cent between 1997 and 2018 (from 0.5 per cent up to 1.4 per cent), we’re still in the bottom rung when it comes to other EU member states, where we straggle into third-to-last place, just behind Romania and Malta.
- River water quality. Roughly one-third of our river water is classified as polluted for the 2016 to 2018 period. That’s about a two percent increase in pollution from the 2013 to 2015 average.
- Special Areas of Conservation (SACs) under the EU Habitats Directive. Another marginal (but important-to-highlight) decline here – the total land area figure for SACs under this Directive slid from 13.2 per cent in 2016 to 13.1 per cent in 2018. That makes us the eighth-worst performer under the Directive.
What’s stayed the same
- Our per capita emissions. That number comes out to about 13.3 million tonnes per person when you divide our total emissions by our population for 2018, which is the exact same number for the year that came before it. (This is just an average produced in the data. The amount of emissions actually attributable to each person varies wildly). So, once again, we are the third-highest emitter per capita in the EU.
- Special Areas of Conservation under the EU Birds Directive. This figure stayed steady with its two-year predecessor at 6.1 per cent for 2018. We’ve come in third-last on this too, and between the Birds and Habitats Directive, the State is in some hot water with the EU.
Where we’re doing better than before
Okay, now onto the somewhat slightly better news.
- Wind-generated electricity is continuing to grow. By 2018, over a quarter of Ireland’s electricity was generated by wind, up nearly four per cent from the year before. Meeting international and regional climate targets will require a lot more, but we’ve seen quite a bit of growth in the market, as the sector wasn’t generating any of our electricity thirty years ago. When accumulated with other renewable sources, about one third of our electricity now comes from renewable sources. (And there’s still a long way to go – last year’s Climate Action Plan wants to more than double that figure by 2030).
- There are more climate-friendly cars on the road. Last year saw 12.6 per cent of all new cars licenced for the first time register as hybrid or electric, up from a mere 1.7 per cent in 2015. (But again, there is a lot left to be desired climate-wise. Based on last years new car registration, almost 100,000 fell outside of this category. Total amount of newly licenced cars for 2019? 113,305. The government also wants to see the total amount of electric vehicles on our roads grow expotentially to one million, according to the Climate Action Plan).
- Sulphur dioxide emissions are still on a downward trend. The air pollutant fell to 12,300 tonnes for 2018, an almost thousand-tonne drop from 2017. It mainly enters the atmosphere through solid fuel burning (like coal, peat and wood) and through road traffic. As our power stations have moved away from coal and towards gas (which also comes with its own set of climate implications), we’ve seen a reduction in how much sulphur dioxide we put into our atmosphere.
- People are taking more public transport. There was a 4.2 per cent increase in the number of public bus and coach journeys being taken and we saw a 5.4 per cent increase in rail journeys in 2018. (This figure will be drastically different for 2020 when the data comes out due to lockdown).
Other trends of note
Two other things caught my eye going through these indicators that don’t specifically fit within the year-on-year comparison format, but are interesting, nonetheless.
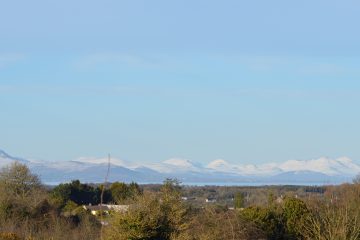
- There hasn’t been a recent update on forestry figures. The tree cover figure we have for both Ireland and the EU is four years old. Back then, forests accounted for just 11 per cent of Ireland’s total land area, the second lowest in the EU.
- Natural gas has had quite the comeback in the past couple of years. Looking at the Primary Energy Production table of the report, you see natural gas taper out to 10 per cent between 2010 and 2014 and then it falls even further, down to 6 per cent in 2015. It then skyrockets up to 59 per cent in 2016 and stays within the high-50s right up until 2018. (This due to the Corrib Gas Field coming on stream four years ago). Climate hawks will be keeping an eye on this fuel in the coming years as activists push against its use as a “bridge fuel” and the coalition government of Fianna Fáil, Fine Gael and the Green Party have pledged to withdraw the terminal from the PCI list in 2021, stating in the Programme for Government that the development of such terminals does not “make sense” as the country “moves towards carbon neutrality”.
Expect these numbers to look completely different for the 2020 data when it comes out due to the pandemic. But, even though we’ll see a dip in emissions to some degree, it still won’t be enough without systemic change.

July 6th, 2017 With the Fossil Fuel Divestment Bill subject to pre-legislative scrutiny in the Dáil last week, Lia Flattery Read more
Globally, conventional agriculture is still following the same model of working with the land that led to the great dust Read more
July 13th, 2017 With the EU (Withdrawal) Bill – better known as the Great Repeal Bill – being published today, Read more
July 21st, 2017 Humans are the root cause of the ‘biological annihilation’ of life on Earth, according to a study Read more